Architecture Design
4.1 Typical System Topology
The reference topology for a critical data transmission security system organizes network zones in a layered defense model, where each boundary crossing requires explicit authorization and cryptographic verification. The design starts from the Internet edge and works inward through progressively more trusted zones, with the PKI/KMS and SIEM infrastructure positioned as shared services that support all zones without being directly reachable from untrusted networks.
The topology is designed for a medium-to-large enterprise with Internet-facing APIs, internal microservices, site-to-site replication, and privileged admin access requirements. Smaller deployments may consolidate the DMZ and App Zone onto fewer physical devices, while larger environments may replicate each zone across multiple availability zones or data centers for resilience.
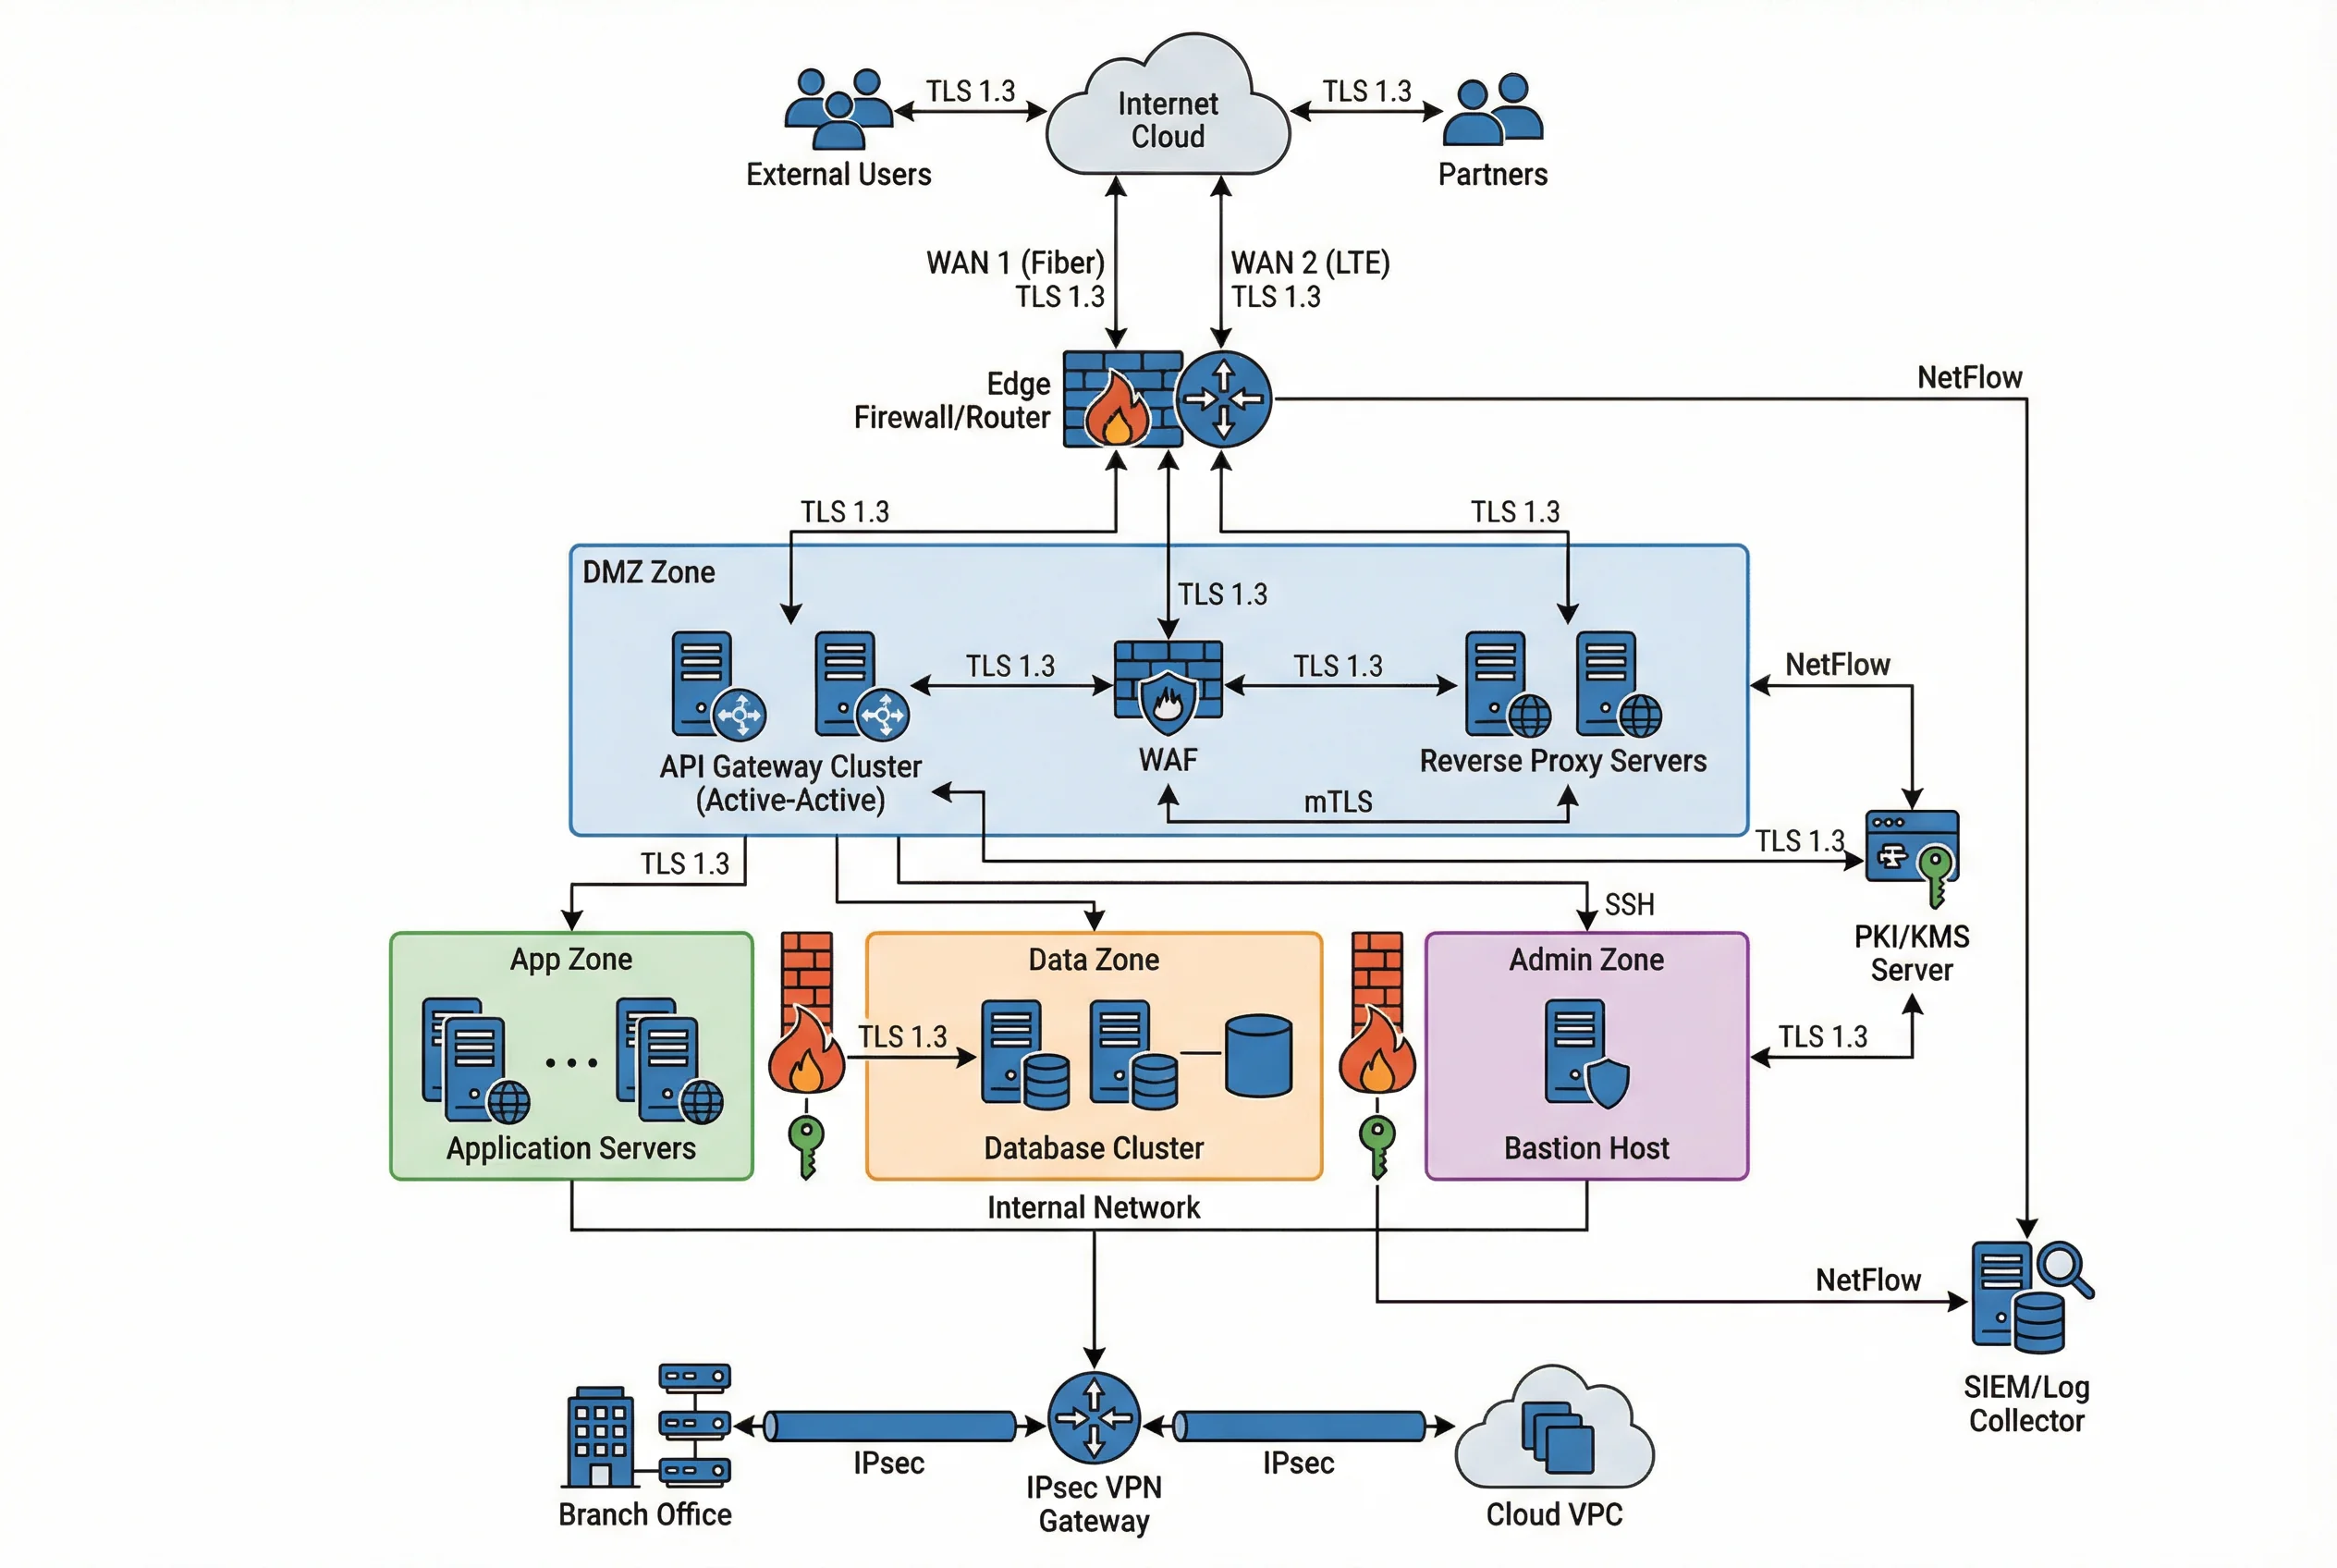
Zone Definitions and Trust Levels
| Zone | Trust Level | Primary Components | Inbound Sources | Outbound Targets | Key Controls |
|---|---|---|---|---|---|
| Internet | Untrusted | External users, partners, attackers | N/A | Edge Firewall only | None (hostile) |
| Edge | Semi-trusted | Edge Firewall, WAN routers | Internet (filtered) | DMZ only | Stateful firewall, DDoS mitigation |
| DMZ | Low-trust | API Gateway, WAF, Reverse Proxy | Edge | App Zone (mTLS) | TLS termination, auth enforcement, WAF rules |
| App Zone | Medium-trust | Application servers, microservices | DMZ (mTLS) | Data Zone (mTLS) | Service mesh mTLS, network policy |
| Data Zone | High-trust | Database cluster, object storage | App Zone only | Replication (IPsec) | Encryption at rest, strict ACL |
| Admin Zone | Privileged | SSH Bastion, management servers | Admin workstations (MFA) | All zones (audited) | MFA, session recording, PAM |
| VPN/WAN | Controlled | IPsec gateways | Branch, Cloud VPC | App/Data Zone | IKEv2, AES-256-GCM, PFS |
| Shared Services | Infrastructure | PKI/KMS, SIEM, NTP | All zones (pull) | All zones (push logs) | Isolated management network |
4.2 Device Interconnection and Wiring
Physical and logical device interconnection follows a structured cabling plan that separates production traffic, management traffic, and replication traffic onto distinct VLANs and physical paths where feasible. Color-coded cabling conventions — orange for WAN/production, blue for management, green for replication — reduce miscabling risk during installation and maintenance. All rack-mounted appliances are connected to a dedicated out-of-band (OOB) management switch that provides console access and IPMI/iDRAC connectivity independent of the production network.

Physical Connectivity Matrix
| Source Device | Destination Device | Interface Type | VLAN / Network | Protocol | Redundancy |
|---|---|---|---|---|---|
| Edge Firewall | Core Switch | 10G SFP+ | VLAN 10 (DMZ) | 802.1Q trunk | LAG (2 links) |
| Core Switch | API Gateway 1/2 | 10G SFP+ | VLAN 10 (DMZ) | 802.1Q access | Active-Active |
| API Gateway | App Servers | 10G SFP+ | VLAN 20 (App) | mTLS/HTTPS | Load balanced |
| App Servers | DB Cluster | 10G SFP+ | VLAN 30 (Data) | mTLS/TLS 1.3 | Primary/Replica |
| PKI/HSM | All devices | 1G RJ45 | VLAN 40 (Mgmt) | HTTPS/ACME | HA pair |
| All devices | SIEM/Log Server | 1G RJ45 | VLAN 40 (Mgmt) | Syslog/TLS | Redundant path |
| All devices | OOB Mgmt Switch | 1G RJ45 (IPMI) | VLAN 50 (OOB) | IPMI/iDRAC | Independent path |
| DB Cluster | Backup Storage | 10G SFP+ | VLAN 60 (Repl) | Encrypted replication | Dedicated VLAN |
4.3 High Availability and Redundancy Design
High availability is achieved through active-active or active-standby redundancy at every critical component, combined with health-check-based failover and automated certificate renewal to prevent availability gaps from cryptographic expiry. The design targets a Recovery Time Objective (RTO) of 30 seconds for Tier-0 flows and 5 minutes for standard flows, with a Recovery Point Objective (RPO) of zero for stateful gateway configurations synchronized via HA protocols.
| Component | HA Model | Failover Trigger | Failover Time | State Sync | RTO Target |
|---|---|---|---|---|---|
| API Gateway | Active-Active (LB) | Health check failure | ≤ 5 sec | Session persistence via LB | ≤ 5 sec |
| Edge Firewall | Active-Standby | Link/heartbeat failure | ≤ 30 sec | Connection table sync | ≤ 30 sec |
| IPsec Gateway | Active-Standby | Tunnel/IKE failure | ≤ 30 sec | IKE SA sync | ≤ 30 sec |
| PKI/CA | Primary + Offline Root | Manual (planned) | Minutes (planned) | CRL/OCSP replication | Minutes |
| KMS/HSM | Active-Active cluster | Node failure | ≤ 10 sec | Key sync via HSM protocol | ≤ 10 sec |
| SIEM | Primary + Hot Standby | Process/disk failure | ≤ 5 min | Log forwarding buffer | ≤ 5 min |
| WAN Links | Dual diverse paths | Link down / BFD | ≤ 10 sec | BGP/static failover | ≤ 10 sec |
4.4 Phased Deployment Plan
A phased deployment approach reduces risk by establishing foundational controls first and layering additional capabilities as operational confidence grows. Each phase has defined entry criteria, deliverables, and acceptance tests before the next phase begins. The typical delivery timeline for a medium enterprise is 8–16 weeks, depending on existing infrastructure maturity and organizational change management capacity.
| Phase | Duration | Key Activities | Deliverables | Acceptance Criteria |
|---|---|---|---|---|
| Phase 1: Foundation | Weeks 1–3 | PKI/KMS deployment, NTP hardening, flow mapping, firewall baseline | CA hierarchy, key policies, flow inventory | CA issues certs; NTP synchronized; flow map approved |
| Phase 2: Transport | Weeks 4–7 | TLS 1.3 enforcement, mTLS for critical APIs, IPsec tunnels, SSH bastion | TLS profiles, mTLS configs, IPsec SAs, bastion runbook | Zero TLS 1.0/1.1; mTLS handshake success ≥99.5%; tunnels stable |
| Phase 3: Segmentation | Weeks 8–11 | Zone firewall rules, egress control, DNS governance, service mesh | Firewall matrices, egress allow-list, mesh policy | Default-deny verified; no unauthorized east-west flows |
| Phase 4: Observability | Weeks 12–14 | NetFlow coverage, SIEM correlation rules, alert tuning, dashboards | NetFlow coverage report, SIEM playbooks, dashboards | ≥90% chokepoint coverage; MTTD ≤15 min for test incidents |
| Phase 5: Hardening | Weeks 15–16 | Automation testing, cert rotation drills, tabletop exercises, documentation | Rotation runbooks, DR test results, final acceptance pack | Rotation success ≥99.5%; DR RTO met; acceptance pack signed |