System Components
1.1 System Architecture
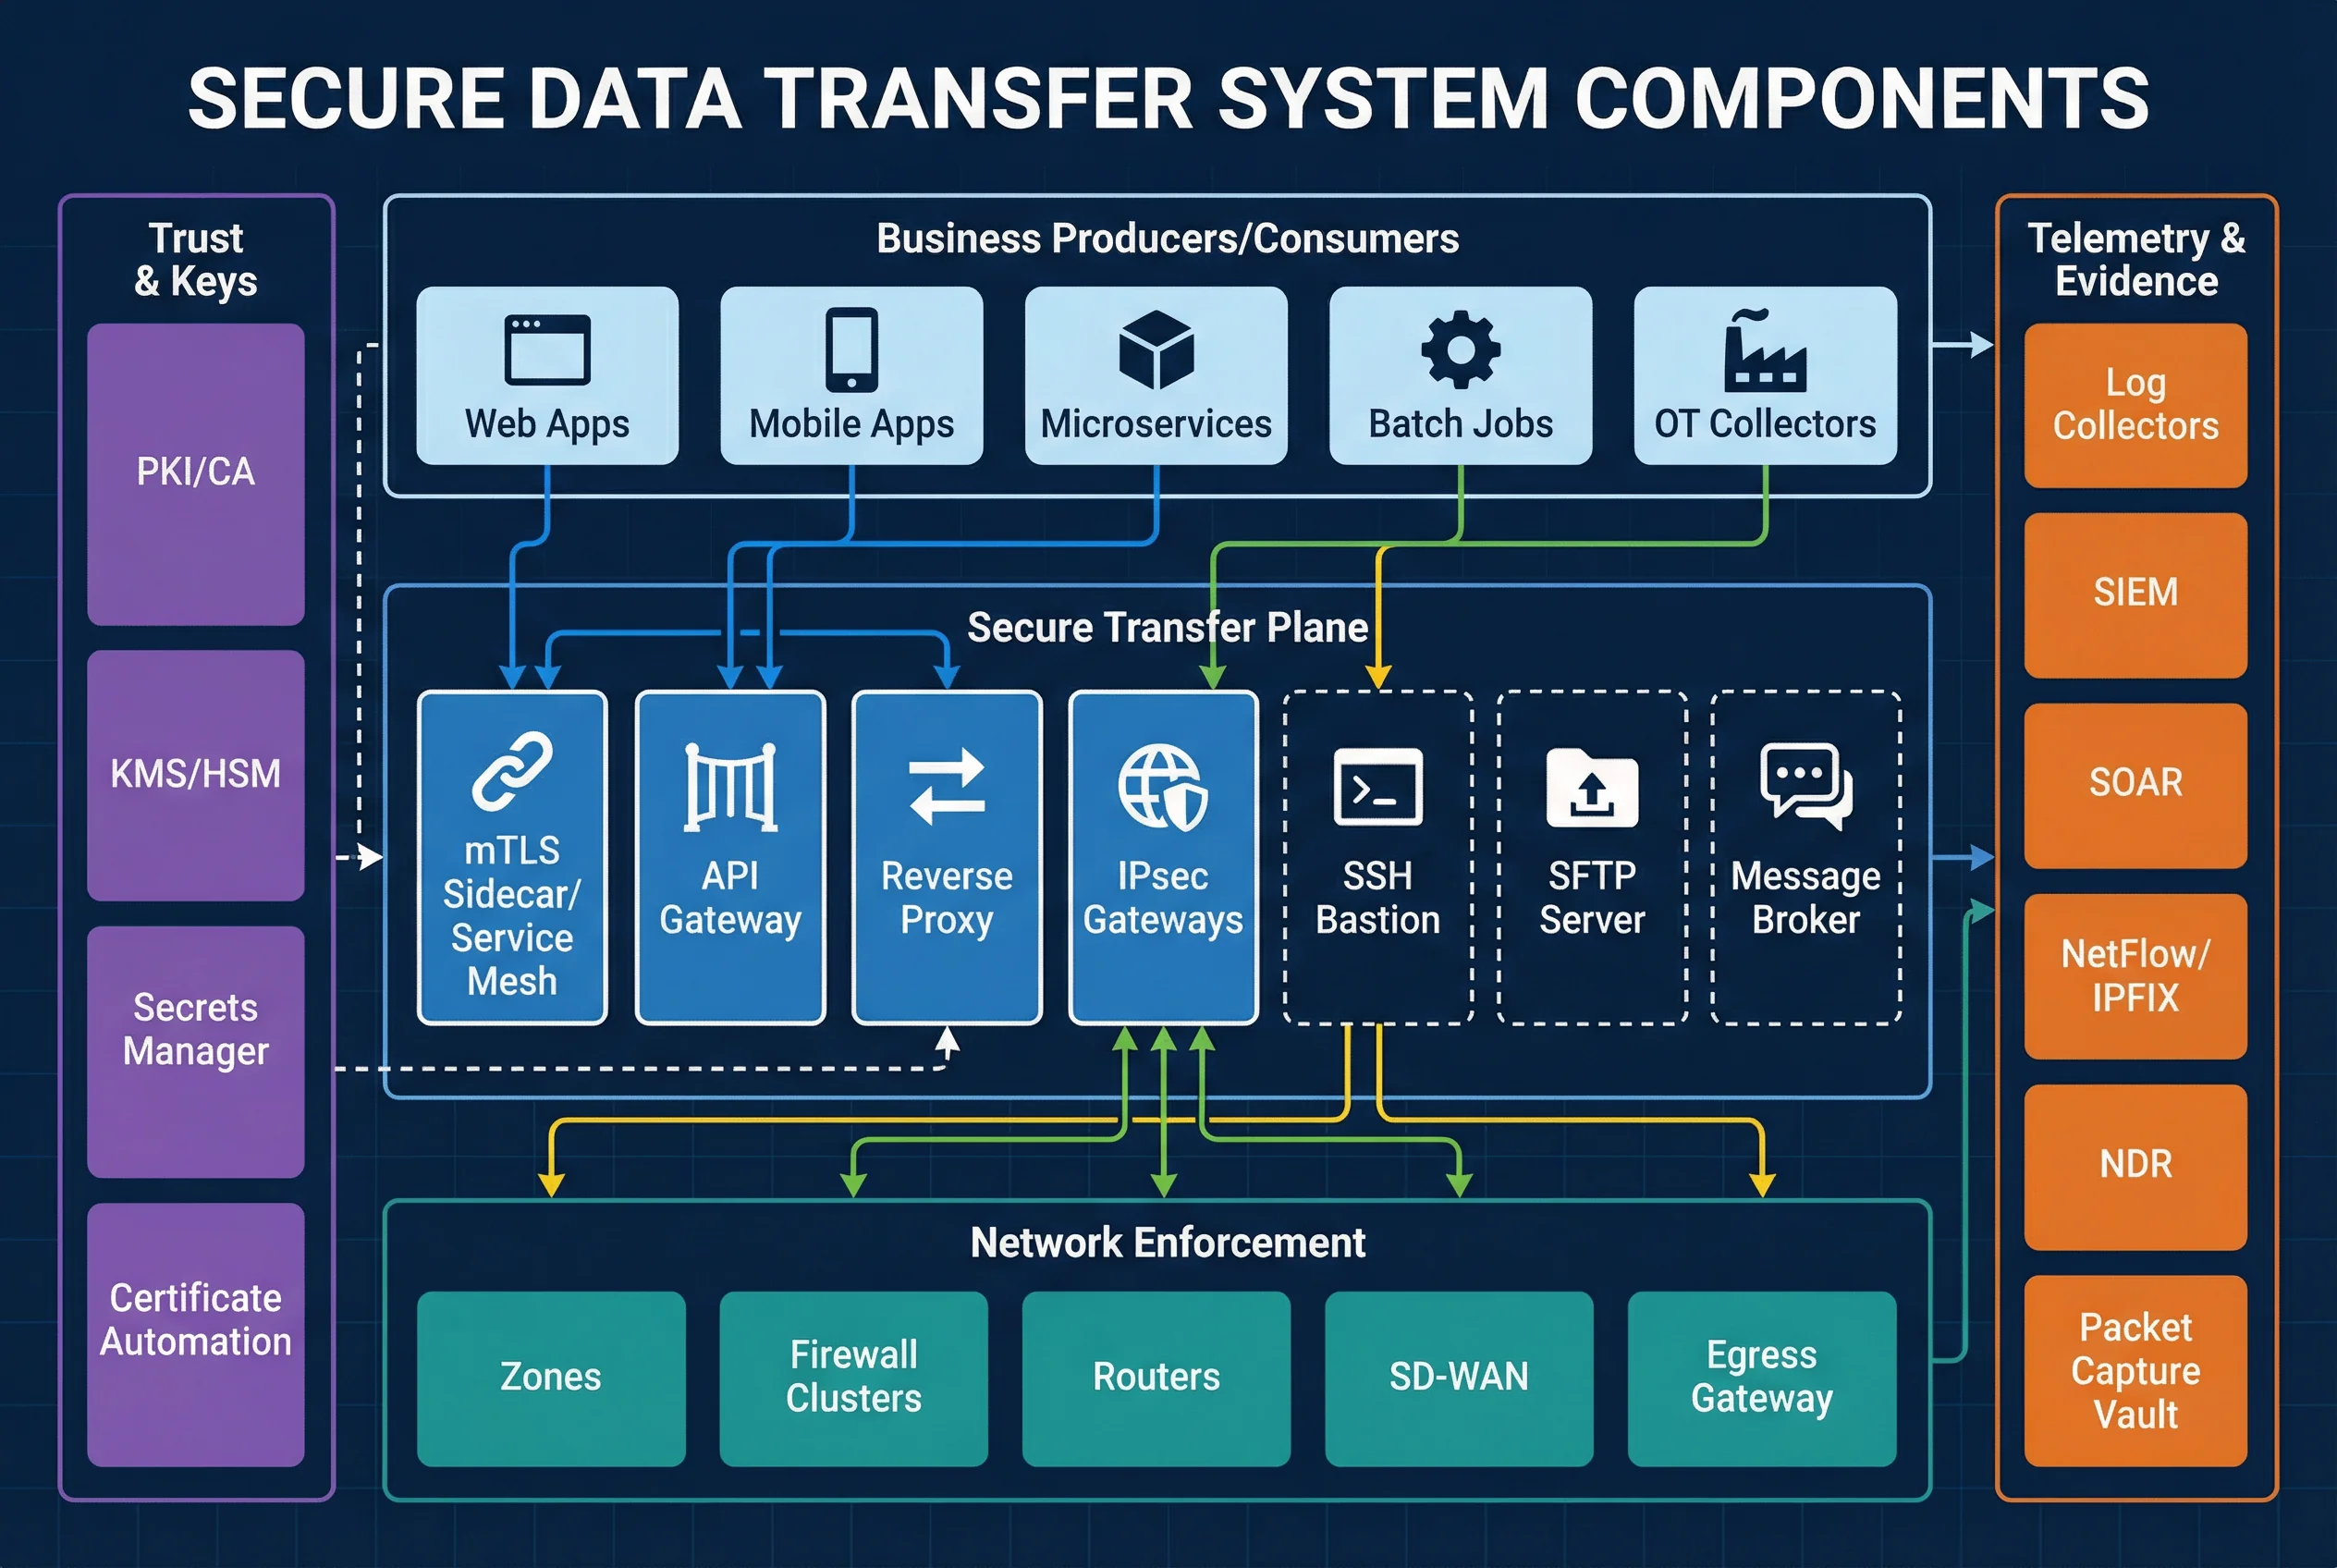
The secure data transfer system is organized into five interdependent functional planes that together enforce end-to-end protection for critical data in transit. The architecture is designed to be modular, allowing organizations to adopt core controls immediately while phasing in optional capabilities such as service mesh sidecars, NDR sensors, and packet capture vaults as operational maturity grows.
At the top of the stack, business producers and consumers — including web applications, mobile clients, microservices, batch jobs, and OT collectors — generate and consume critical data. These workloads interact with the Secure Transfer Plane, which encompasses all transport-layer enforcement mechanisms. The Trust and Keys plane provides the cryptographic foundation, while the Network Enforcement plane constrains where traffic may flow. The Telemetry and Evidence plane collects, correlates, and preserves all observable signals for detection and forensics.
Module relationships follow a clear data flow: producers send critical payloads through approved transport mechanisms (TLS/mTLS, IPsec, SSH). The control plane governs this by having PKI issue certificates, policy engines define allowed identities and routes, and gateways enforce access decisions. All events are exported to the telemetry pipeline for real-time detection and long-term forensic retention.
Deployment Boundaries
The architecture distinguishes between core controls that must be present in any compliant deployment and optional controls that enhance detection or forensic capability. The following table summarizes these boundaries.
| Classification | Components | Rationale |
|---|---|---|
| Core | PKI/KMS, TLS/mTLS enforcement, API Gateway, IPsec Gateways, SSH Bastion, Firewall/Segmentation, SIEM/Logging | Required for baseline compliance and auditability |
| Optional | Service Mesh Sidecars, NDR Sensors, Packet Capture Vault, ZTNA Broker | Enhance detection depth and forensic evidence quality |
1.2 Components and Functions
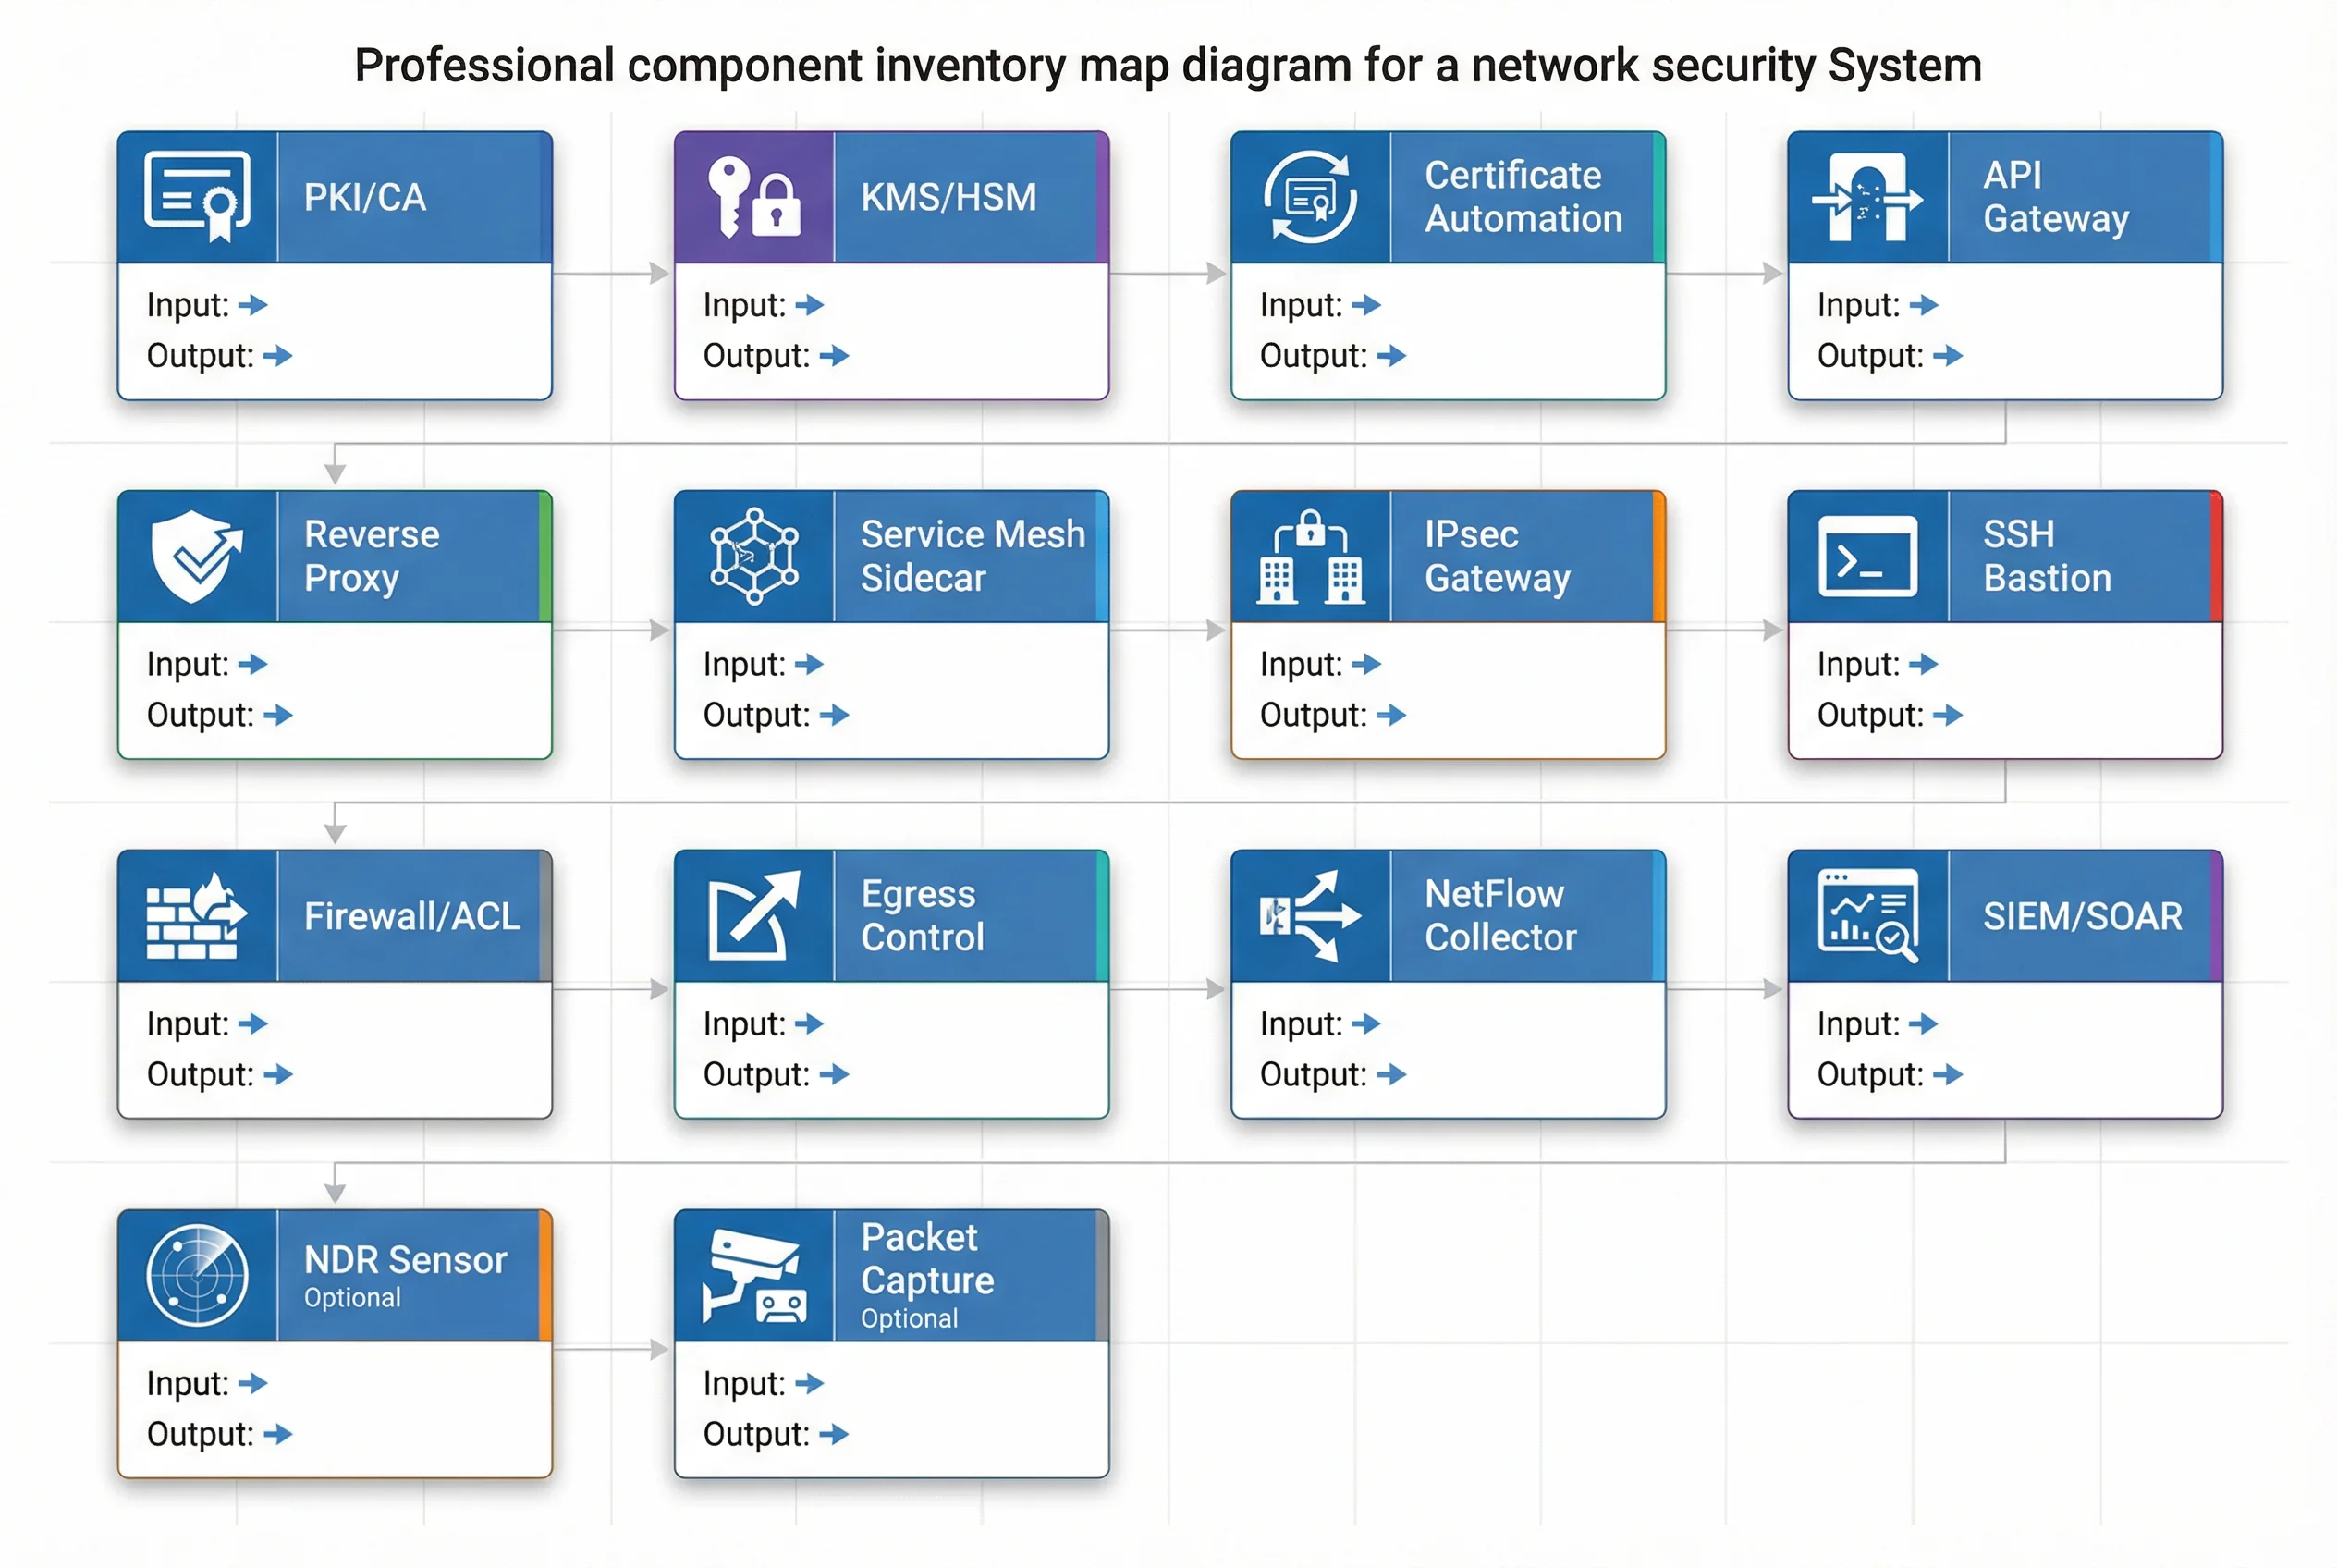
Each component in the secure data transfer system has a clearly defined primary responsibility, set of inputs and outputs, key engineering metrics, and a mismatch risk — describing what breaks when the component is absent or misconfigured. The component inventory map below provides a visual overview of the full component set and their interconnections.
| Component | Primary Responsibility | Inputs | Outputs | Key Metrics | Mismatch Risk |
|---|---|---|---|---|---|
| Data Classification Registry | Identify critical data sets and owners | Data inventory, labels | Classification tags, policies | Coverage %, update latency | Blind spots → unprotected flows |
| Flow Mapping Repository | Maintain end-to-end flow map | Topology, app configs | Approved flow list | Map completeness, drift rate | Wrong allow-lists, outages |
| PKI/CA | Issue/validate certificates | CSR, policy | Certs, CRL/OCSP | Issuance latency, revocation time | mTLS failure or rogue acceptance |
| KMS/HSM | Protect private keys & signing ops | Key requests | Keys, signatures | HSM ops/sec, key export policy | Key theft, compliance failure |
| Certificate Automation | Rotate/renew certificates | CA API, agents | Updated certs | Rotation success %, MTTR | Expired cert outage |
| API Gateway | Controlled API ingress/egress | HTTPS requests | Routed calls, logs | p95 latency, auth errors | Bypass exposure, auth drift |
| Reverse Proxy | Minimize exposed services | Inbound TLS | Internal TLS | TLS termination rate, errors | Direct access to internal services |
| Service Mesh / mTLS Sidecar | Service-to-service mTLS | App traffic | Encrypted traffic | Handshake success, overhead | East-west plaintext leakage |
| IPsec Gateway / VPN | Site-to-site secure tunnel | Routed packets | Encrypted tunnel | Throughput, rekey time | Tunnel drops, asymmetric routing |
| SSH Bastion | Secure admin access | Admin sessions | Proxied sessions, logs | Session count, command logs | Direct SSH exposure |
| Firewall/ACL | Segmentation default-deny | Flows | Allowed/blocked | Rule hit rate, drops | Lateral movement if permissive |
| Egress Control | Control outbound & DNS | Outbound connections | Allowed egress | Block rate, DNS integrity | Data exfil via uncontrolled exits |
| NetFlow/IPFIX | Flow-level observability | Routers/firewalls | Flow records | Export coverage, delay | Blind detection of anomalies |
| SIEM/SOAR | Correlate & respond | Logs/flows | Alerts, cases | MTTD, false positive rate | Missed incidents |
| NDR Sensor (Optional) | Detect anomalies in traffic | Taps/SPAN | Detections | Detection rate, drift | Stealthy exfil missed |
| Packet Capture Vault (Optional) | Forensic evidence | Capture triggers | PCAP evidence | Retention, integrity checks | No proof, weak IR |
1.3 Working Principle
Startup Flow
The system follows a structured bootstrap sequence to establish trust before any critical data flows. First, CA policies and key protection are configured, and all nodes are time-synchronized via NTP — a prerequisite for certificate validity and log integrity. Second, services and devices enroll and receive certificates, with short-lived certificates issued where possible to minimize exposure windows. Third, gateways and firewalls load allow-lists derived from the approved flow map, ensuring only pre-authorized paths are open. Finally, log pipelines, NetFlow exporters, and alert rules are enabled and tested before production traffic is admitted.
Normal Operation Flow
During normal operation, every critical data transfer follows a consistent security lifecycle. A client or service initiates a session, triggering a TLS/mTLS handshake that validates the peer's identity against the trusted certificate store. Authorization checks at the gateway or mesh layer confirm that the requesting identity is permitted to access the target resource. Data is transferred with integrity protection via AEAD cipher suites, and all events — connection metadata, authorization decisions, and application audit records — are exported to the telemetry pipeline. The SIEM correlates these signals in near-real-time to detect anomalies and generate alerts.
Exception and Recovery Flow
When anomalies are detected — such as handshake failures, replay attempts, or policy violations — the system responds by blocking the offending session and generating an alert. The affected endpoint is isolated pending investigation, and credentials are rotated or revoked as appropriate. Service is restored via known-good configurations, and a postmortem review updates detection rules and rotation job health checks to prevent recurrence.
Three Abnormal Link Chains
| Scenario | Detection Signal | Immediate Response | Recovery | Postmortem Action |
|---|---|---|---|---|
| Expired Certificate Chain | Client handshake fails; gateway logs "cert expired" | SIEM triggers critical alert; automation renews cert | Validate mTLS restored end-to-end | Review rotation job health; add pre-expiry alerting at 14 days |
| Unexpected Cross-Zone Traffic | Firewall blocks new east-west flow; NDR flags lateral movement | SOAR isolates source host; incident team verifies legitimacy | Update flow map and rule only after approval | Tighten zone policy; add simulation test to regression suite |
| Replay/Token Abuse | API gateway detects repeated request signatures or nonce reuse | Rate limit + block; revoke token/session; force re-auth with MFA | Forensics uses trace IDs + NetFlow to reconstruct attack chain | Improve nonce uniqueness enforcement; reduce token TTL |